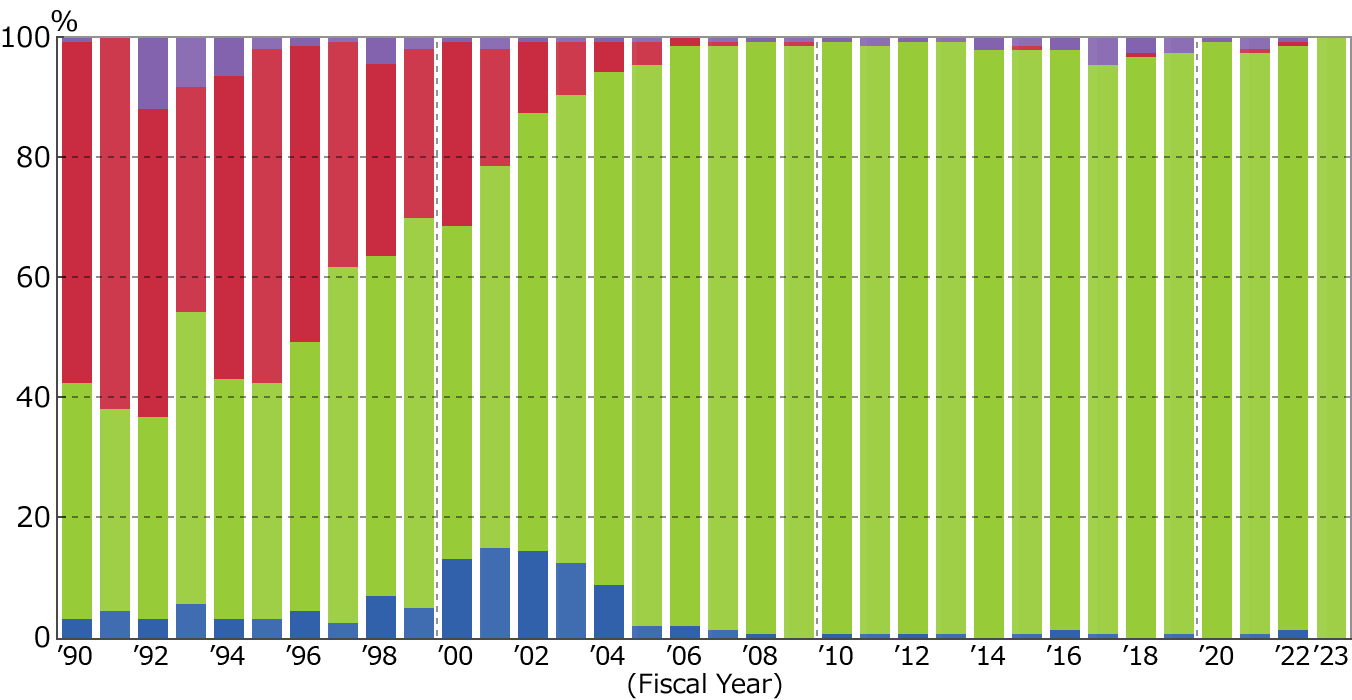
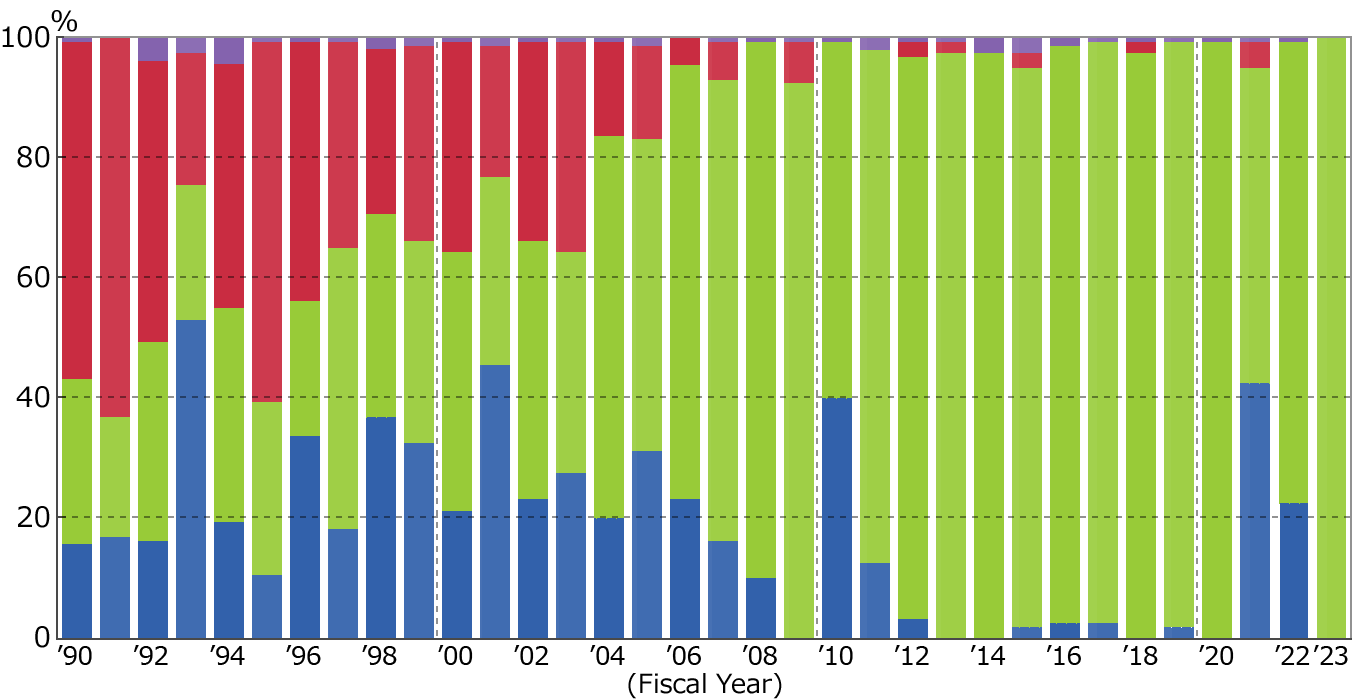
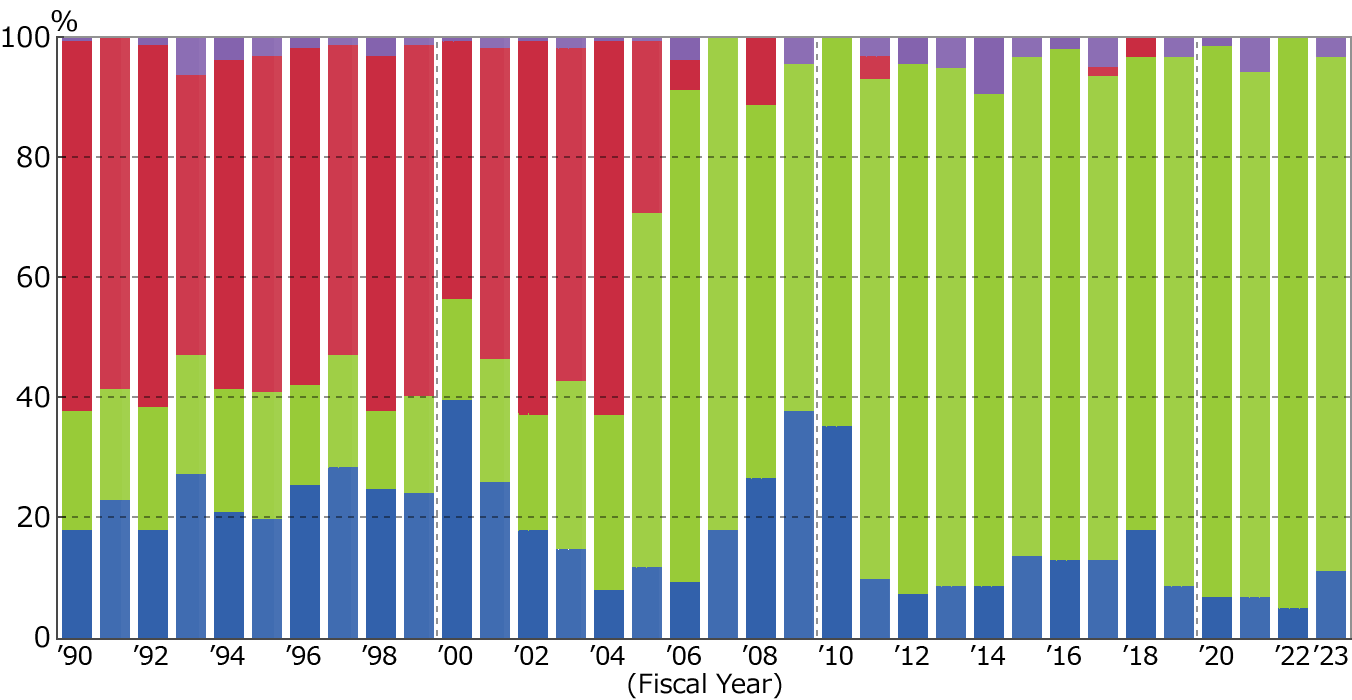
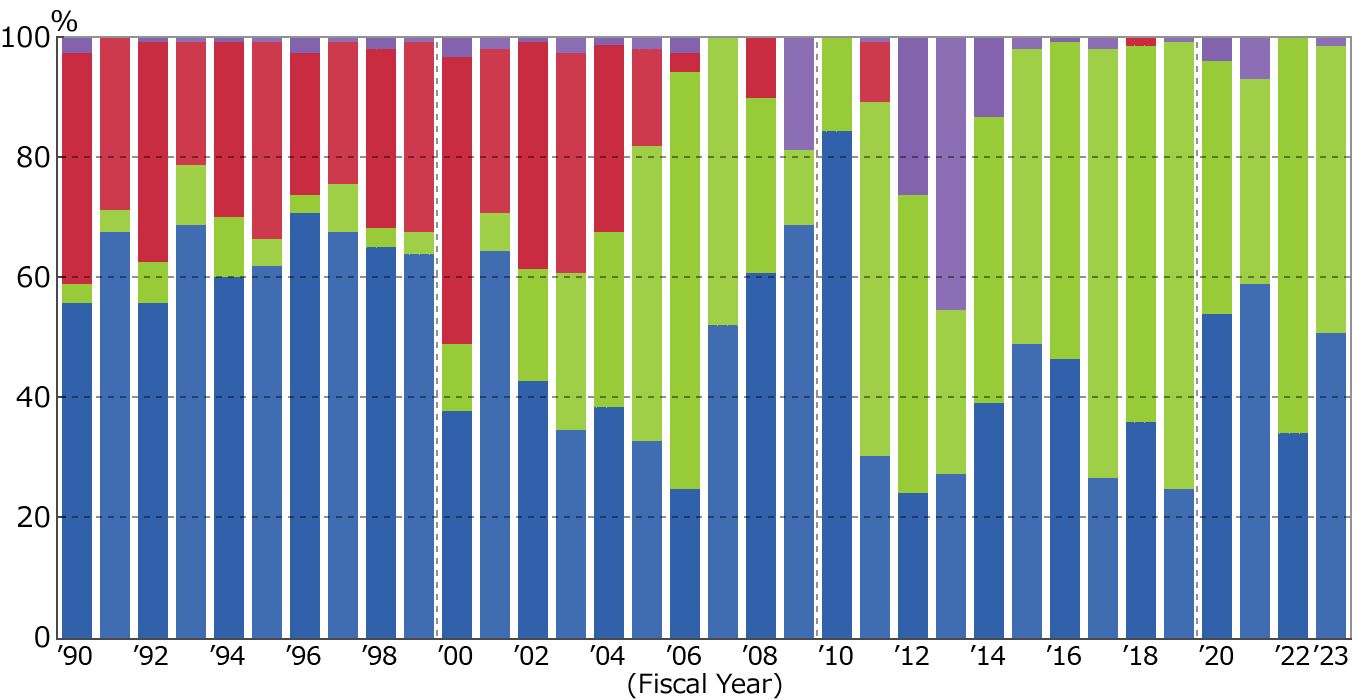
Prime Mover (new & renewal)
CHP Status by Prime Mover
in the last 10 years (as the end of March 2023)
Prime Movers | Commercial | Industrial | Total | |
Net Installed Units (unit) |
Gas Turbine | 17 | 110 | 127 |
Gas Engine | 4,874 | 995 | 5,869 | |
Diesel | 10 | 4 | 14 | |
Steam Turbine*1+FC | 84 | 38 | 122 | |
total | 4,985 | 1,147 | 6,132 | |
Net Installed Capacity (MW) |
Gas Turbine | 38 | 768 | 806 |
Gas Engine | 525 | 1,010 | 1,535 | |
Diesel | 5 | 3 | 8 | |
Steam Turbine*1+FC | 5 | 219 | 224 | |
total | 573 | 2,000 | 2,573 | |
Average Capacity (kW/unit) |
Gas Turbine | 2,262 | 6,979 | 6,348 |
Gas Engine | 108 | 1,015 | 262 | |
Diesel | 491 | 795 | 578 | |
Steam Turbine*1+FC | 55 | 5,772 | 1,836 | |
total | 115 | 1,744 | 420 |
---|
*1 It is immediately after the examination's beginning, and only a part of results is reflected.
Share of Prime Mover by units(as the end of March 2023)
In Commercial Sectors
![Share of Prime Mover by units In Commercial Sectors (as the end March 2022)](img/2023/cs0060B.png)
In Industrial Sectors
![Share of Prime Mover by units In Industrial Sectors (as the end March 2022)](img/2023/cs0060C.png)
Share of Prime Mover by Capacity (as the end of March 2023)
In Commercial Sectors
![Share of Prime Mover by Capacity In Commercial Sectors (as the end March 2022)](img/2023/cs0060D.png)
In Industrial Sectors
![Share of Prime Mover by Capacity In Industrial Sectors (as the end March 2022)](img/2023/cs0060E.png)
CHP Status by Prime Mover
(as the end of March 2023)
Prime Movers | Commercial | Industrial | Total | |
Net Installed Units (unit) |
Gas Turbine | 600 | 1,032 | 1,632 |
Gas Engine | 13,102 | 2,579 | 15,681 | |
Diesel | 2,121 | 2,405 | 4,526 | |
Steam Turbine*1+FC | 214 | 103 | 317 | |
total | 16,037 | 6,119 | 22,156 | |
Net Installed Capacity (MW) |
Gas Turbine | 567 | 5,088 | 5,655 |
Gas Engine | 1,497 | 2,811 | 4,308 | |
Diesel | 716 | 2,547 | 3,263 | |
Steam Turbine*1+FC | 24 | 418 | 441 | |
total | 2,804 | 10,863 | 13,667 | |
Average Capacity (kW/unit) |
Gas Turbine | 946 | 4,930 | 3,465 |
Gas Engine | 114 | 1,090 | 275 | |
Diesel | 337 | 1,059 | 721 | |
Steam Turbine*1+FC | 111 | 4,056 | 1,393 | |
total | 175 | 1,775 | 617 |
---|
*1 It is immediately after the examination's beginning, and only a part of results is reflected.
Share of Prime Mover by units(as the end of March 2023)
In Commercial Sectors
![Share of Prime Mover by units In Commercial Sectors (as the end March 2022)](img/2023/cs0060F.png)
In Industrial Sectors
![Share of Prime Mover by units In Industrial Sectors (as the end March 2022)](img/2023/cs0060G.png)
Share of Prime Mover by Capacity (as the end of March 2023)
In Commercial Sectors
![Share of Prime Mover by Capacity In Commercial Sectors (as the end March 2022)](img/2023/cs0060H.png)
In Industrial Sectors
![Share of Prime Mover by Capacity In Industrial Sectors (as the end March 2022)](img/2023/cs0060I.png?v=2)